Last updated: 17 November 2025
Accessing Symbient Uptime
New User Registration
To register as a new user for Symbient Uptime, follow these steps:
- Navigate to the homepage at Symbient Uptime.
- Click on the "Sign up" link located in the upper-right section of the menu bar.
- In the Sign-up pop-up window:
- Enter your email address in the text box labeled "email".
- Enter a unique password in the text box labeled "password".
- Enter your password again to confirm in the text box labeled "Confirm Password".
- Your password must adhere to the Symbient Uptime Password Policy.
- Click the "Create Account" button to complete the registration.
- If successful, a "Success" pop-up window will appear. Click the OK button to proceed to User Login.
- If any errors occur, an error message will be displayed.
Logging In
To log in as a user for Symbient Uptime, follow these steps:
- Navigate to the homepage at Symbient Uptime.
- Click on the "Login" button found in the upper-right section of the menu bar.
- In the Login pop-up window:
- Enter your email address in the text box labeled "email".
- Enter your password in the text box labeled "password".
- Click the Login button to finish logging into Symbient Uptime.
- If successful, the Symbient Uptime Dashboard will be displayed.
- Should any errors occur, an error message will be displayed.
Forgot Password
To reset your password in Symbient Uptime, follow these steps:
- Navigate to the homepage at Symbient Uptime.
- Click on the "Login" button in the upper-right section of the menu bar.
- Click on the "Forgot password?" button.
- Enter your email in the text box labeled "Email".
- Click on the "Send Reset Link" button to complete the password reset process.
- The success pop-up window will appear.
- An email will be sent to the address you provided under "Email".
- Click the "Reset Your Password" button.
- In the reset your password window:
- Enter your email in the text box labeled "email".
- Enter your new password in the text box labeled "new password".
- Enter your password again in the text box labeled "confirm password".
- Your password must adhere to the Symbient Uptime Password Policy.
- Click on the "Submit" button.
- A success popup window will appear.
- Your password will be successfully changed.
Request Demo
To request a demo session for Symbient Uptime, follow these steps:
- Navigate to the homepage at Symbient Uptime.
- Click on the "Request Demo" button found below the menu bar, or click on the "Contact" button on the menu bar.
- In the Request Demo popup window:
- Enter your full name in the text box labeled "Full Name".
- Enter your work email address in the text box labeled "Work Email".
- Enter your company name in the text box labeled "Company Name".
- Enter your phone number in the text box labeled "Phone Number".
- Enter your preferences for the demo in the text box labeled "What would you like to see in the demo?".
- Click the "Schedule Demo" button to complete the demo session request.
Contact Sales
To contact sales for Symbient Uptime, follow these steps:
- Navigate to the homepage at Symbient Uptime.
- Click on the "Contact Sales" button found below the menu bar, or click on the "Contact" button on the menu bar.
- In the Contact Sales pop-up window:
- Enter your full name in the text box labeled "Full Name".
- Enter your work email address in the text box labeled "Work Email".
- Enter your company name in the text box labeled "Company".
- Enter your phone number in the text box labeled "Phone Number".
- Enter your preferences in the text box labeled "How can we help you?".
- Click the "Send Message" button to complete the contact sales request.
Start Free Trial
To start a free trial for Symbient Uptime, follow these steps:
- Navigate to the homepage at Symbient Uptime.
- Click on the "Contact" button in the menu bar and click on the Start Free Trial button
- In the Start Free Trial popup window:
- Enter your email address in the text box labeled "Email".
- Enter your password in the text box labeled "Password".
- Enter your password again to confirm in the text box labeled "Confirm Password".
- Your password must adhere to the Symbient Uptime Password Policy.
- Click the "Create Account" button to complete your free trial account.
Dashboard
The Symbient Uptime Dashboard provides a comprehensive snapshot of all Notifiers currently registered under Symbient Uptime. It concisely summarizes each Monitor, including detailed information about their current status. Users can delve into each Monitor to view or modify its configuration and can easily add new Monitors directly from the Dashboard.
To get to the Dashboard, click on the Speedometer icon in the top of the left-hand Menu Bar.
Quick Stats
The Quick Stats section summarizes the status of the different assets being monitored:
- Up: Represents the total count of Monitors with operational assets or "up".
- Down: Indicates the total count of Monitors with non-operational assets or "down".
- Paused: Shows the total number of Monitors on hold and not actively monitoring any assets.
- Unknown: Reflects the total count of Monitors with an inactive status for unspecified reasons. This could mean the Monitor is not active and does not indicate if the asset being monitored is "up" or "down".
Dashboard Details
The Dashboard shows summary information about each Monitor. The Dashboard shows the following:
- Name: This is the "friendly name" of the Monitor to help quickly identify the Monitor. Clicking on a Monitor’s name directs you to its configuration page. For detailed instructions on configuring the Monitor, please see Configure a Monitor.
- Active: Displays the current operational status of the Monitor.
- "Yes" indicates the Monitor is active and running.
- "No" indicates the Monitor is inactive.
- Status: Indicates the asset’s last known status (Up, Down, or NA).
- "NA" indicates the Monitor has run successfully but does not expect a status of "Up" or "Down", which can occur when a server is inaccessible over the open web.
- Date/Time: Shows the date and time the Monitor last ran.
- Last Message: The last message Symbient Uptime recorded when the Monitor last ran.
- Tags: Tags are used for labeling, organizing, and filtering data points or assets.
Monitors
Adding & Configuring Monitors
In Symbient Uptime, Monitors track a given asset's availability. Symbient Uptime will send out a notification indicating the asset's current status according to the configuration settings of the Monitor.
To set up a new Monitor, do the following:
- Click the Monitors icon on the Menu Bar.
- Click the "Add New Monitor" button.
- You should currently be on the "Details" tab. If not, click on this tab at the top of the page underneath "Monitor".
- Set the Monitor Type. For definitions of Monitor Type, see Glossary of Terms.
- API - for details on how to use an API Monitor, see How to Use an API Monitor.
- DNS
- HTTP(s)
- HTTP(s) + Keyword
- Ping
- TCP Port
- Enter a Friendly Name for the Monitor. This will be the primary display name for the Monitor.
- Depending on the Monitor Type, if the field is available, enter the following:
- URL
- Hostname
- Keyword
- Tag
- Set the Heartbeat Interval.
This setting defines how often the Monitor will run. The minimum value for this interval will depend on your currently active membership. If you need an interval lower than what is currently available to you, please consider upgrading your membership on the Settings page.
- Click Save.
This process will create the Monitor with a unique Monitor ID. The Monitor ID can be found in the upper-right corner when viewing the Monitor’s details.
To activate the Monitor, see Configuring Advanced Settings for Monitors.
To set Extra Options for the Monitor, see Extra Options for Monitors.
To set the notification for a given Monitor, see Adding Notifiers to Monitors.
Configuring Advanced Settings for Monitors
Advanced settings help to further configure the Monitor for a given asset. Depending on the Monitor Type, different Advanced setting options are available.
For each Advanced setting, simply check the box to set it or uncheck the box to unset it.
General Advanced Settings
The following Advanced settings are always available regardless of the Monitor Type:
- Monitor is active: Enabling "Monitor is active" will activate the Monitor. The Monitor will check the asset based on the Heartbeat interval. Unchecking the "Monitor is active" will stop the monitoring of the asset.
- Upside Down Mode: Enabling "Upside Down Mode" inverts the Notifier's output. In this mode, a reachable asset will be reported as "down". Some potential use cases of this feature are:
- Flag services that should be internal but are externally accessible, identifying potential security risks.
- Assist in verifying the effectiveness of failover mechanisms by indicating active primary systems as 'down'.
- Enable testing of Alert configurations without the need for a real downtime event.
- Create scenarios for IT staff training, allowing practice in troubleshooting and responding to Alerts in a controlled setting.
Monitor Type-Specific Advanced Settings
The following Advanced settings are only available for certain Monitor Types:
- Certificate Expiry Notification: Enabling "Certificate Expiry Notification" will send Alerts as the certificate approaches its expiration date. Notifiers will be issued 30, 21, 14, 7, and 1 day before a certificate’s expiration.
- Ignore TLS/SSL error for HTTPS websites: Enabling "Ignore TLS/SSL error for HTTPS websites" will cause Symbient Uptime to ignore any TLS/SSL errors encountered when monitoring an asset.
Extra Options for Monitors
Extra Options vary depending on the Monitor Type.
DNS
- Resolver Server: The server that translates domain names into IP addresses for the Monitor.
- Resource Record Type: The type of DNS record (like 'A' or 'CNAME') the Monitor is tracking.
HTTP(s) and HTTP(s) + Keyword
- Method: The type of HTTP request used, including:
- GET
- POST
- PUT
- PATCH
- DELETE
- OPTIONS
- Authentication: The method used for securing access, including:
- None
- HTTP Basic Auth
- NTLM
- Body: The data sent in the request, typically used in POST requests.
- Headers: The metadata included in the request, such as content type or authentication information, including:
- Content-Type: Specifies the media type of the resource (e.g., application/JSON, text/html).
- Authorization: Contains credentials for authentication (e.g., Bearer tokens).
- Accept: Indicates the content types the client can handle (e.g., application/XML, image/jpeg).
Adding Notifiers to Monitors
When a Monitor detects a problem with an asset it oversees, Symbient Uptime uses the configured Notifiers for that specific Monitor to relay the issue to the target Email or Webhook.
When configuring a Monitor:
- Click on the Notifiers tab.
- Ctrl+click any or all of the Notifiers found in the section on the left and move them to the section on the right by clicking the arrow buttons in the middle.
- If there are no Notifiers in the section on the left, see Adding a Notifier.
- Use the single arrow buttons to move any selected Notifiers between the lists.
- Use the double arrow buttons to move all Notifiers from one list to the other.
- If users accidentally move all Notifiers and want to reset, they can refresh the page to return to the original configuration.
- Click Save to apply the new settings.
Using an API Monitor
The Uptime API Monitor enables monitoring of any servers, systems, or devices capable of calling a webhook. Symbient Uptime provides a quick and easy-to-use Uptime Agent that can be installed on any system for integration with an API Monitor. Users also have the flexibility to use their own code or tools, provided they have the functionality to call a webhook.
- Create an API Monitor. See Add New Monitor.
- Be sure to set the "Monitor Type" to API.
- Install a program on the server to call the Monitor. Choose one of the options below:
- Using the Uptime Agent:
- Using a custom program that can call a webhook:
- Install a program that is able to call webhooks on the device that is being monitored.
- Authorize the program with Symbient Uptime.
- Get your "API Key" and "Enc Key". See Integrations.
- Pass "X-API-Key" header with the value of your "API Key".
- Pass "X-Enc-Key" header with the value of your "Enc Key".
- Get the "monitorid" for the target Monitor.
- Open or create an API Monitor.
- Click the Monitor ID in the top-right corner to copy it. This will be used to replace {monitorid} in the request URL below.
- Post an HTTP request to /api/v1/monitor/notify/{monitorid} where "{monitorid}" is the "Monitor ID" you obtained above.
- The body of the request should be a JSON object with the following values:
- status: This is either "up" or "down", depending on how you have your Monitor configured (i.e., checking "Upside Down Mode" in your monitor configuration would flip the status).
- payload: This is a nested JSON object that can contain information about the server or device that initiates the API/webhook call, such as disk space, CPU percentage, temperature, server name, or other identifiable information.
- Schedule your custom program to run using Task Scheduler (for Windows) or cron (for Linux). For more information regarding Task Scheduler for Windows, please see the Windows section below.
- Be sure to schedule your program to run at an interval that is more frequent than the API Monitor’s Heartbeat Interval setting.
Example HTTP body request:
{
"status": "up",
"payload": {
"server_name": "example.com",
"total_disk_space": 1073741824,
"used_disk_space": 1000000,
"free_disk_space": 1073740824,
"used_disk_space_percentage": 9.3
}
}
- Activate the API Monitor to begin receiving webhook API calls from your custom program. See Configuring Advanced Settings for Monitors.
The Symbient Uptime API swagger page is available to test integrations:
- Symbient Uptime API Doc: Symbient Uptime API Documentation.
NOTE: The timing of the message for calling the API Monitor webhook has to be less than the interval set on the Monitor’s Heartbeat. For example, if your Monitor’s Heartbeat Interval is set to 5 (minutes), schedule your custom program to call the API Monitor webhook every four (4) minutes or less (but not less than 1 minute). This will ensure the Monitor doesn’t inadvertently trigger its Notifiers because it hasn’t received a notification within its Heartbeat Interval.
Notifiers
Notifiers are how Symbient Uptime will communicate any issues a Monitor finds. It is possible to define multiple Notifiers and designate one or more per Monitors.
Notifiers Dashboard
The Notifiers Dashboard displays all the Notifiers set up in Symbient Uptime. It not only displays them but also allows for adding new Notifiers as well.
To get to Notifiers, click on the Notifiers icon on the Menu Bar.
The Notifiers Dashboard page shows summary information about each Notifier. It shows the following:
- Name: This is the "friendly name" of the Notifier to help quickly identify the Notifier. It is also a link to the Notifier, which allows for the quick viewing/updating of the Notifier’s configuration.
- Type: Displays the Notifier Type
- Email Notifier
- Webhook Notifier
Note: For instructions on how to set up a Notifier, see Configure Notifiers.
Adding A Notifier
To add a Notifier:
- Click the Notifiers icon on the menu bar on the left of the screen.
- Click the "Add Notifier" button.
- The "Add New Notifier" screen will open, so the Notifier can now be configured.
Configuring Notifiers
Symbient Uptime currently supports two (2) notification types: Email Notifier and Webhook Notifier. Depending on which notification type is selected, different required and optional fields are available.
Any time a Monitor encounters any issues with an asset being monitored, an Alert is generated and communicated via a Notifier.
- If the Alert needs to be communicated to an individual or a group of people, the preferred Notifier is an Email Notifier.
- If the Alert needs to be communicated to another system or application, the preferred Notifier is a Webhook Notifier.
Note: A Monitor can be configured to use multiple Notifiers, to include different types, for any Alert.
Email Notifier
To configure an Email Notifier, do the following:
- Select a Notifier Type of "Email".
- Enter the Required fields:
- Friendly Name
- Hostname
- Username
- From Email
- To Email
- Enter any optional information:
- Description
- Port
- Security
- Ignore TLS Error
- Password
- CC
- BCC
- Custom Subject
- Click Save.
- Click the "Test" button to test the Notifier.
- Click the "Dismiss" button to return to the Notifier Dashboard view page.
Webhook Notifier
To configure a Webhook Notifier, do the following:
- Select a Notifier Type of "Webhook".
- Enter the Required fields
- Friendly Name
- URL
- Enter any optional information:
- Description
- Click Save.
- Click the "Test" button to test the Notifier.
- Click the "Dismiss" button to return to the Notifier Dashboard view page.
Installing & Configuring the Uptime Agent on Local Servers
Note: This only applies to the Monitor Type of API.
What is the Uptime Agent, and why/when do I need it?
Symbient Uptime is intended to test the availability of servers. It is assumed that the servers being monitored are publicly accessible over the open Internet. However, in many situations, servers are hidden behind firewalls, such as those in corporate environments, or otherwise prohibited from being accessed directly. In this case, Symbient Uptime provides a utility called "Uptime Agent" that can be installed locally on servers that need to be monitored by Symbient Uptime.
To install the Uptime Agent
- Ensure that your current version of .NET is up to date. The latest version of .NET 6.0 can be found here: https://dotnet.microsoft.com/en-us/download/dotnet/6.0
- Download the Uptime Agent tool for your environment here:
- Downloads: Click here to get the latest uptime-agent-windows-x86-64.zip for Windows x86-64.
- Extract the file using your unzipping tool of choice.
- Open the folder where you unzipped the download from above.
- Locate and open the "settings.conf" file using a text editor of your choice.
- Copy and paste the API and Enc keys from Symbient Uptime into the apikey and enckey fields, and save the file. Your API and ENC keys will be used to authorize your Uptime Agent.
- For more information, see Integrations.
- Create a new Monitor and choose "API" as the "Monitor Type". See Adding Monitors.
- Click the Monitor ID in the top-right corner to copy it to your clipboard.
- Paste this ID into the settings.conf file for the monitorid value.
- Save and close the settings.conf file.
Windows
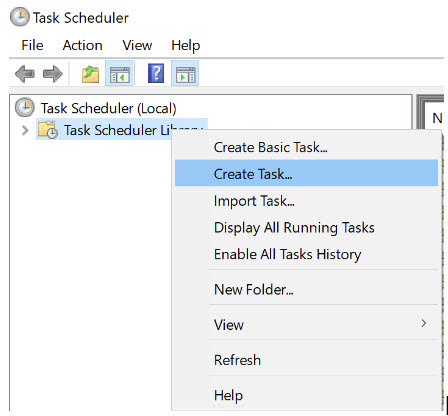
- Click the Start button and type "Task Scheduler," and click to open it. Alternatively, press Ctrl+R to open the Run dialog. Type "taskschd.msc" and press the Enter key. This will launch the Windows Task Scheduler.
- Right-click on "Task Scheduler Library" on the left, and select "Create Task…".
- For the "Name" field, enter "Symbient Uptime Agent".
- Click the "Triggers" tab and click "New…" under Settings.
- Select "One time" with a start time of "12:00:00 AM".
- Under Advanced Settings
- Check the box for "Repeat task every" with a value of "5 minutes".
- Change "for a duration of" to "Indefinitely".
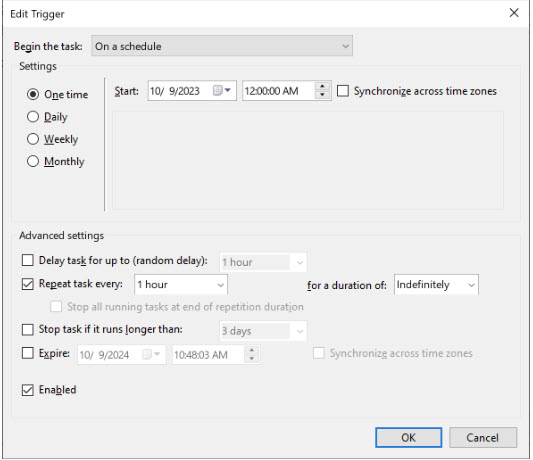
- Click OK to close the Trigger dialog.
- On the Create Task dialog:
- Next to "Program/script", click the "Browse…" button.
- Navigate to and select "uptime-agent.exe" from the folder where you extracted the download in Step 1.
- Click the OK button to close the New Action dialog.
- Click the OK button again to close the Create Task dialog.
The settings specified in the instructions above tell Windows to run the uptime-agent.exe file every 5 minutes indefinitely. When the Uptime Agent runs, it will calculate how much disk space is available on your system and send that to the Symbient Uptime platform. This action notifies Symbient Uptime that the server running the Uptime Agent is online and accessible to other systems on your internal network.
In the event the uptime-agent.exe file fails to run or fails to communicate with the Symbient Uptime network, the Monitor for this server will deem the server as offline or otherwise unavailable and will, in turn, trigger any Notifiers associated with this Monitor.
- We recommend setting the Monitor associated with this Uptime Agent to a heartbeat interval of 10 minutes.
Note: Do not configure the Task Scheduler to run the uptime-agent.exe utility in less than 5-minute durations.
Additional applications can be used to watch this Monitor and take necessary action based on the payload passed by the uptime-agent.exe tool. For example, suppose available disk space is running low and drops below a predefined threshold. In that case, you may wish to trigger other events, such as notifying a network admin that the server is running low on disk space.
The Uptime Agent utilizes the Symbient Uptime Notify API. See Symbient Uptime API Documentation.
Devices
This Devices dashboard shows a list of all devices that have ever connected to Uptime. Whenever new devices connect to Uptime, those devices automatically appear on the dashboard without the user having to refresh. To know more about configuring Symbient Safeguard, Click Here.
To get to Devices, click on the Devices icon on the Menu Bar.
The dashboard includes columns for:
- Machine Name
- Device ID
- Manufacturer
- Username
- OS Name
- OS Version
- OS Build Number
- Is 64-bit?
- Total Physical Memory
- # of Processors
- Last Seen
With the exception of the Last Seen column (which will be updated every time the device publishes an event), all of the fields/columns listed above are populated by the Symbient Safeguard Desktop application.
The Machine Name and Device ID columns are links that, when clicked, will open the “Device” page.
Details Tab
In the Details tab, the same details as above, with the addition of below details of the device are present:
- Manufacturer
- Device ID
- Product ID
- Machine Name
- Username
- OS Name
- OS Version
- OS Build Number
- Is 64-bit?
- Total Physical Memory
- # of Processors
- Processor Name
- Processor Speed
- Last Seen
- MAC Addresses
- Antivirus Products
- IP Addresses
- Drives
Events Tab
The Events Tab includes the following information:
- Timestamp
- Possible Event Type (such as “High Process Memory” or “Incoming Port Scan Detected”)
- Severity (1-5)
To View Historical Data in the Events Tab:
- Click on the "Show Historical Data" button.
- Enter the Start Date and End Date in the Start and End fields to view the events for that period.
- Click on the Search button.
- Click on the Show Live button to view live events.
Network Tab
Not yet implemented
SIEM Events
The SIEM Events dashboard shows all the SIEM events across all devices. Event data updates in real-time in the browser whenever new events are published from the Symbient Safeguard Desktop application. To know more about configuring Symbient Safeguard, Click Here.
To get to SEIM Events, click on the SEIM Events icon on the Menu Bar.
The dashboard includes columns for:
- Timestamp
- Possible Event Type (such as “High Process Memory” or “Potential Ransomware Activity”)
- Device ID
- Machine Name
- Username
- Severity (1-5, rows should be color-coded based on severity to make it quick and easy to identify things that are high severity)
- To see more details about an event, click on the green "+" button on the left side of the table. This will provide the following additional information:
- Description
- Metadata (string of additional information provided by Safeguard)
The SIEM Events dashboard shows only the latest 500 results.
How to View Historical SIEM Events
The SIEM Events dashboard shows only the latest 500 results. To View Historical SIEM Events:
- Click on the "Show Historical Data" button.
- Enter the Start Date and End Date in the Start and End fields to view SIEM events for that period.
- Click on the Search button.
- Click on the "Show Live" button to view live events.
Scans
Scan in Symbient Uptime checks for potential issues and anomalies in the IT infrastructure. It scans for errors, misconfigurations, performance issues, and security vulnerabilities.
To get to Scans, click on the Scans icon on the Menu Bar.
The dashboard includes columns for:
- Name
- Service Type
- Scan Frequency
- Is Active
- Last Run
- Status
The Scan Name column is a link that, when clicked, will open the “Scan Details” page.
Details Tab
In the Details tab, the following details of the scan are present:
- Name
- Scan is active?
- Target
- Service Type
- Scan Frequency
- Last Ran
History Tab
In the History tab, the following details of the scan are present:
- Date
- Status
- Report
How to Create a Scan Configuration:
To create a Scan Configuration, do the following:
- Click on the Add button at the top.
- Enter the required fields:
- Name
- "Scan is active?" Checkbox
- Target
- Service Type
- Scan Frequency
- Enter the Optional fields:
- Report Recipient Emails (press enter between)
- The "Last Ran" field gets populated by the last date we Run Scan for it.
- Click on the Save button.
- After being prompted that the Scan has been saved successfully, click OK.
How to Delete a Scan Configuration:
To delete a Scan Configuration, do the following:
- Click on the Name of the configuration you want to delete.
- Click on the Delete button.
- Click Yes when prompted to Confirm.
How to Run a Scan
To Run a Scan, do the following:
- Click on the name of the configuration you want to run the scan for.
- Click on the Run Scan button at the bottom-right.
- After being prompted that the Scan has been submitted, click OK.
Users
The Users page allows you to manage any users within your Team. This includes adding new Team members, editing team member details, and deleting Team member accounts. You must have the Company Admin or User Manager Roles to access the Users page.
To get to Users, click on the Users icon on the Menu Bar.
Adding New Users:
To add new users, follow these steps:
- Click on the Add button.
- The "Add New User" screen will open, where the new user can be created.
- Enter the new member's Login Info. All fields here are required:
- Email.
- Password.
- Password must adhere to the Symbient Uptime Password Policy.
- Confirm Password.
- Check the box on the left of the Role that you want to assign to the user under Roles. Multiple roles can be selected.
- Click on the "Save button.
- After being prompted that a Team Member has been added, click Dismiss to return to Account Settings.
Maintaining Team Members
To Delete or Revoke a Security Token for a Team Member to Symbient Uptime, do the following:
- Select the Team Member to maintain by checking the box next to the Team Member.
- Delete or Revoke Security Tokens:
- To delete, click the Delete button.
- To Revoke Security Tokens, click the Revoke Security Tokens button.
- Click Yes when prompted to confirm.
- To cancel, delete, or revoke, click No.
Note: Revoking security tokens removes the user’s login authentication tokens (e.g., "Bearer") from the database and forces all devices to log out that user. When the user successfully logs back into Symbient Uptime, a new token will be created.
To Update a Team Member's Credentials in Symbient Uptime, do the following:
- Click the Team Member email to open the Team Member Details.
- To update their Email:
- Enter a new Email address.
- To update Password:
- Enter new password.
- Confirm new password.
- Password must adhere to the Symbient Uptime Password Policy.
- Click Save.
- After being prompted that a Team Member has been saved successfully, click Okay.
- Click Dismiss to return to Account Settings.
Alerts
Any time a Monitor encounters any issues with an asset being monitored, an Alert is generated and communicated via a Notifier. The Alert is also logged in Symbient Uptime and can be viewed later.
How to View Alerts
To view an Alert, click on the Alert icon from the menu bar. The Alerts Dashboard will be displayed. See Alerts Dashboard.
Alerts Dashboard
The Alerts Dashboard shows all Alerts that any Monitor has generated.
The Alerts Dashboard shows summary information about each Alert. The Dashboard shows the following:
- Alert ID: This is the unique ID generated for each Alert. Click on the Alert ID to see the following:
- Monitor: Name of the Monitor that created the Alert.
- Status: The status of the Monitor when the Alert was created.
- Message: The message the Monitor received when the Alert was created.
- Metadata: If the Alert received any metadata when created, it is displayed here. This could include status codes, server logs, or any preconfigured response data from the asset.
- Monitor: This is the Friendly Name of the Monitor that generated the Alert. Click on the Monitor to view the configuration set up for the Monitor. See Configuring Notifiers.
- Date: Shows the date and time an Alert was created.
- Status: Displays the status of the Monitor at the time the Alert was created.
Departments
A Department allows members who do not have access to Monitors to be assigned Monitors so that they will be able to see/edit them. Only Company Admin and Department Admin can access Departments.
To get to Departments, click on the Department icon on the Menu Bar.
How To Create a Department
- Click on the Add button at the top-left.
- Enter the required field:
- Department Name:
- Enter the optional information:
- Department Description:
- Click on the Save button.
- Click on the Dismiss to return to the Departments page.
How To Delete a Department
- Check the box on the left of the Department you want to delete. Multiple departments can be selected.
- Click on the Delete button.
- Click Yes when prompted to confirm.
How To Add Users to a Department
- Click on the Department Name to which you want to add users.
- Click on the Users Tab.
- Select the user from the "Select To Add Users" dropdown.
- Click on the Add button.
How To Add Monitors to a Department
- Click on the Department Name to which you want to add monitors.
- Click on the Monitors Tab.
- Select the Monitor from the "Select To Add Monitors" dropdown.
- Click on the Add button.
How To Remove User(s)/Monitor(s) from a Department
- Click on the Department Name from which you want to remove User(s)/Monitor(s).
- Click on the Users/Monitors tab.
- Check the box on the left of the Email/Name of the User/ Monitor you want to remove. Multiple Users/Monitors can be selected.
- Click on the Delete button.
- Click Yes when prompted to confirm.
Managing Account Settings
The Account Settings section allows users to modify their profile details. Here, users can update various settings, including their email address, password, team member information, membership type, and payment details.
To reach the Account Settings page, click the Settings icon on the menu bar to reach the Account Settings page.
My Settings
My Settings are used for updating Individual User Settings. You can change your password and email address and delete your account using My Settings.
Change Password
To change your Password, do the following:
- Click on the Settings icon on the Menu Bar.
- This should take you to the My Settings tab. If it does not, click on My Settings.
- In the "Password" field, enter the desired new Password.
- Password must adhere to the Symbient Uptime Password Policy.
- Enter this password again in the "Confirm Password" field.
- Click Save.
Change Email
To change your Email address, do the following:
- Click on the Settings icon on the Menu Bar.
- This should take you to the My Settings tab. If it does not, click on My Settings.
- Enter a new Email address in the text box displaying: "email".
- Changing your password is not required.
- Click Save.
Delete Account
To delete your account with Symbient Uptime, follow these steps:
- Click on the Settings icon on the Menu Bar.
- This should take you to the My Settings tab. If it does not, click on My Settings.
- Click Delete My Account. A warning message is provided, stating:
- Deleting your account also stops and deletes all of your monitors unless other team members remain. None of this can be undone once your account has been deleted.
- Click Yes when prompted to confirm.
- To maintain your account, click No.
My Membership
The My Membership tab is used to view, change, or cancel your Symbient Uptime Plan and to Contact Us. If you have already set your membership, it will be shown next to "Current Plan:".
Selecting or Changing a Membership Plan
To change the plan or to select a plan the first time, do the following:
- Click on the Settings icon on the Menu Bar.
- Click on the "My Membership" tab.
- Select the desired Plan.
- To see monthly vs yearly pricing options for different plans, toggle the slide bar between Month / Yearly.
- Once prompted, enter:
- Payment Method
- If using Saved Payment Method, see My Payment Methods, and select Existing
- If adding New, enter the following:
- CardHolder Name
- Card Number
- Expiry Month
- Expiry Year
- Security Code
- Billing Zip Code
- Check Set as Default Payment Method to make the above payment method the default
- Check Authorize
- Payment Method
- Click Submit.
- To not save a Payment Method, click Dismiss.
Cancel Plan
To Cancel Plan:
- Click on the Settings icon on the Menu Bar.
- Click on the "My Membership" tab.
- Click Cancel Membership.
- When prompted to confirm, click Yes.
- To maintain membership, click No.
Contact Us
To Contact Us:
- Click on the Settings icon on the Menu Bar.
- Click on the My Membership tab.
- Click on Contact Us Here.
- This will take you to Contact.
Payments
The Payments tab is used to view all the payment(s). The following fields of the payment(s) are available:
- Payment ID: A unique ID for the payment. Click the ID to view full details.
- Total Amount: The total amount paid.
- Status: The payment status (e.g., Processing, Completed).
- Date: The date the transaction was completed.
- Next Due Date: The upcoming payment due date (for subscriptions).
How To Request a Refund
To request a refund:
- Click on the Settings icon on the Menu Bar.
- Click on the Payments tab.
- Click on the Payment ID of the payment you want to request a refund for.
- Click on the Request Refund button at the top.
- On the pop-up screen, enter the following information:
- Email Address: Enter your email.
- Reason for Refund: Enter the reason for the refund request.
- Click on the Submit button to send the refund request.
- Click on Dismiss to cancel the refund process.
How to Download/ View a Receipt:
To download/ view a Receipt:
- Click on the Settings icon on the Menu Bar.
- Click on the Payments tab.
- Click on the Payment ID of the payment you want a receipt for.
- Click on the Receipt dropdown button at the top.
- Select one of the two options:
- Email Receipt: To receive a receipt via email:
- Click on Email Receipt.
- Enter the Email Address in the provided box.
- Click on the Send button.
- Click on the Dismiss button to go back to the Payment Details page.
- View Receipt: To view the receipt in Uptime:
- Click on View Receipt.
- Email Receipt: To receive a receipt via email:
My Payment Methods
The My Payment Methods tab is used to identify your payment method(s) and indicate the preferred (default).
Note: For security reasons, payment methods are NOT stored on Symbient Uptime servers.
Add Payment Method
To Save Payment Information:
- Click on the Settings icon on the Menu Bar.
- Click on the My Payment Methods tab.
- Enter the following required information:
- CardHolder Name
- Card Number
- Expiry Month
- Expiry Year
- Security Code
- Billing Zip Code
- Click Save.
Set Default Payment Method
To Set Payment as Default:
- Click on the Settings icon on the Menu Bar.
- Click on the My Payment Methods tab.
- Next to the Payment Method you want to be the default, click Set as Default.
Delete Payment Method
To Delete Payment Method as Default:
- Click on the Settings icon on the Menu Bar.
- Click on the My Payment Methods tab.
- Next to the Payment Method you want to Delete, click Delete.
- If a Scheduled Payment is associated with the Payment Method, the Payment Method cannot be deleted. If a scheduled Payment needs to be canceled please Contact Uptime Support.
Integrations
To integrate with Symbient Uptime, you will use the API Key and ENC Key found on the Integrations tab in Account Settings.
Symbient Uptime will generate these keys for you to use with your integrations.
To find the API and ENC Keys:
- Click on the Settings icon on the Menu Bar.
- Click on the Integrations tab.
- Here you will find your "API Key" and "Enc Key".
- These will be needed for any integrations with Symbient Uptime.
Note: You can click the Copy icon at the end of each field to copy the value to your clipboard.
Downloads
All versions of the product that are available to download are shown on this tab, with the most recent version at the top. Each product version includes a Zip file, major features, release date, and product name and version. The list can also be filtered by product using the dropdown menu at the top.
To download a product:
- Click on the Settings icon on the Menu Bar.
- Click on the Downloads tab.
- Click on the ZIP file of the version of the product you want to download.
Logout
To log out of Symbient Uptime, click the Logout icon on the menu bar.
Symbient Uptime API Documentation
For information about the Symbient Uptime API, click here.
Glossary of Terms
Alert
An Alert refers to a notification generated by Symbient Uptime when a monitored asset changes its status, such as going offline or experiencing performance issues. These Alerts are crucial for prompt awareness and response, ensuring that users can take immediate action to address and resolve any problems with their assets.
Authentication Types
NTLM
New Technology LAN (Local Area Network) Manager: A suite of Microsoft security protocols intended to provide authentication, integrity, and confidentiality to users.
Monitor
Monitors within Symbient Uptime continuously check and report on the availability and performance of a specific asset, like a website or server. Monitors provide real-time updates and alerts, enabling users to quickly respond to any issues affecting their assets.
Monitor Types
API
Application Programming Interface: A way of sending and receiving data, allowing different software applications to communicate with each other.
DNS
Domain Name System: Translates domain names into IP addresses, making it easier for users to access websites without having to remember numerical IP addresses.
HTTP(s)
Hypertext Transfer Protocol: An application protocol for distributed, collaborative, hypermedia information systems that allows users to communicate data, usually on a web browser. The 's' in HTTPS stands for 'secure', securing the communication using encryption and a digital signature. '+ Keyword' refers to a specific action or response desired from the HTTP request.
Ping
Packet Internet or Inter-Network Groper: A network utility that allows a user to test and verify the reachability of a particular destination IP address or host, helping to diagnose connectivity issues.
TCP Port
Transmission Control Protocol: A global communication standard that devices use to reliably transmit data over the Internet. TCP is defined by being connection-oriented, which means that a connection between the client and the server must be established before data can be sent.
Roles
- Company Admin: This role has access to do anything in Symbient Uptime. They can add/edit/delete other users and models, and even maintain their group's membership, payments, and payment methods.
- Accounting Manager: Needed for viewing the Payments and Payment Methods tabs on the Settings page.
- Department Manager: This role has access to add, edit, and delete departments, and add or delete users and monitors from a department.
- Users Manager: Authorized to add, edit, and delete other users from the Users page. However, they cannot change Company Admin permissions.